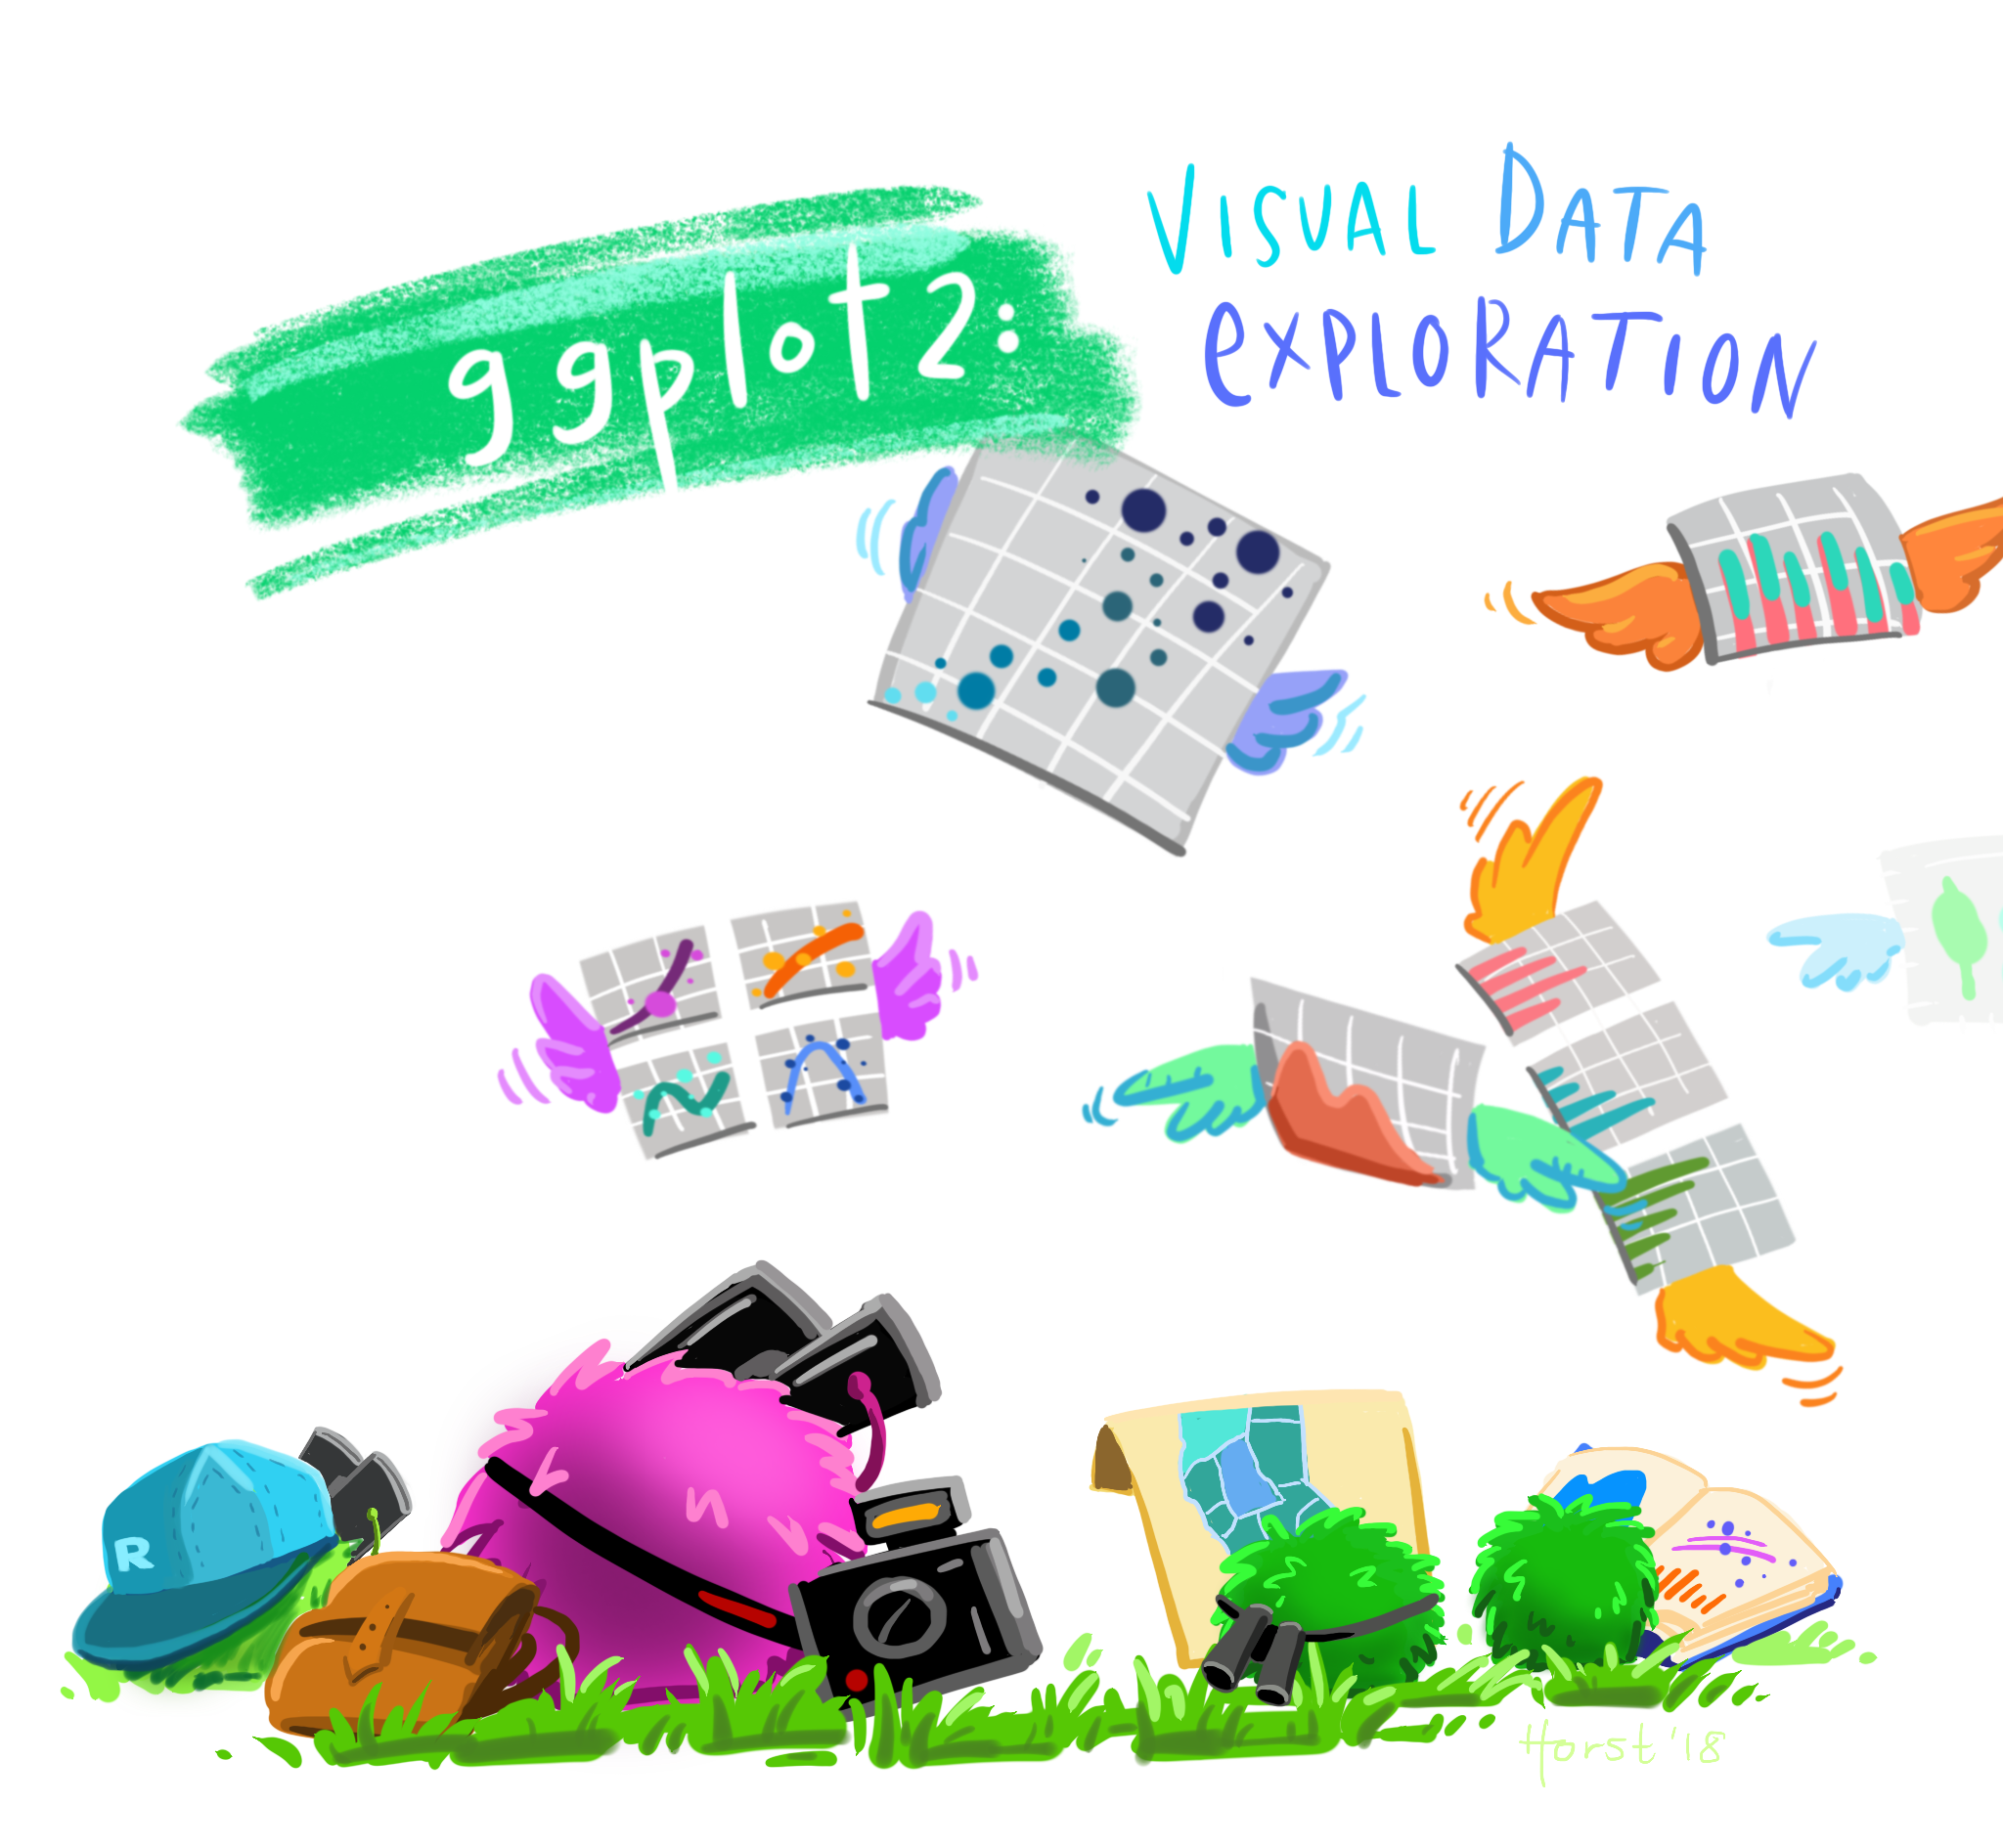
Image by Allison Horst
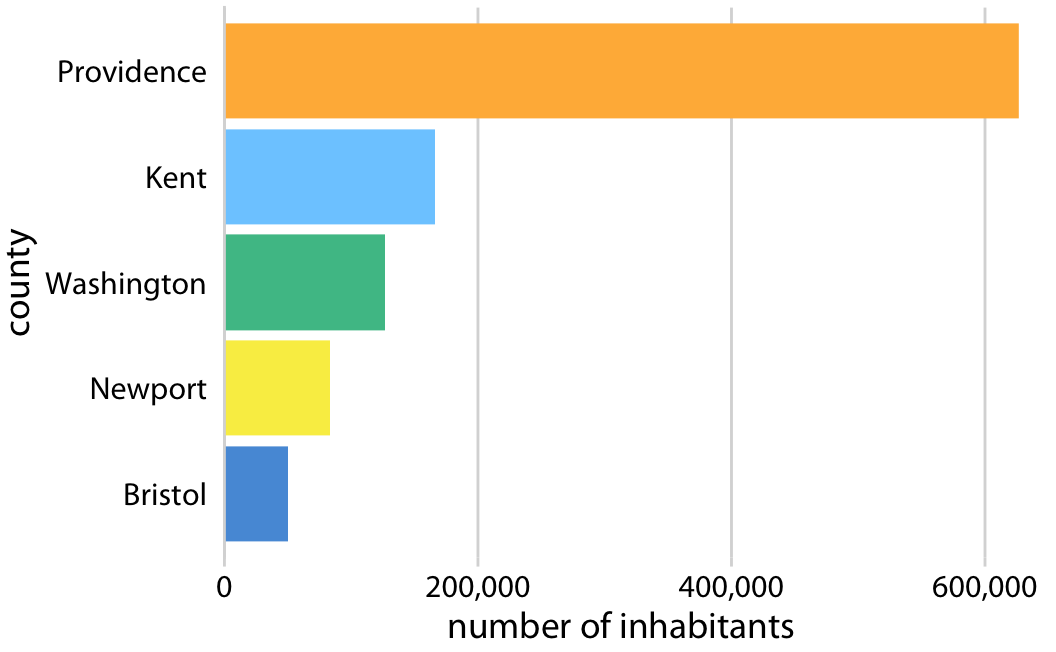
Geometry
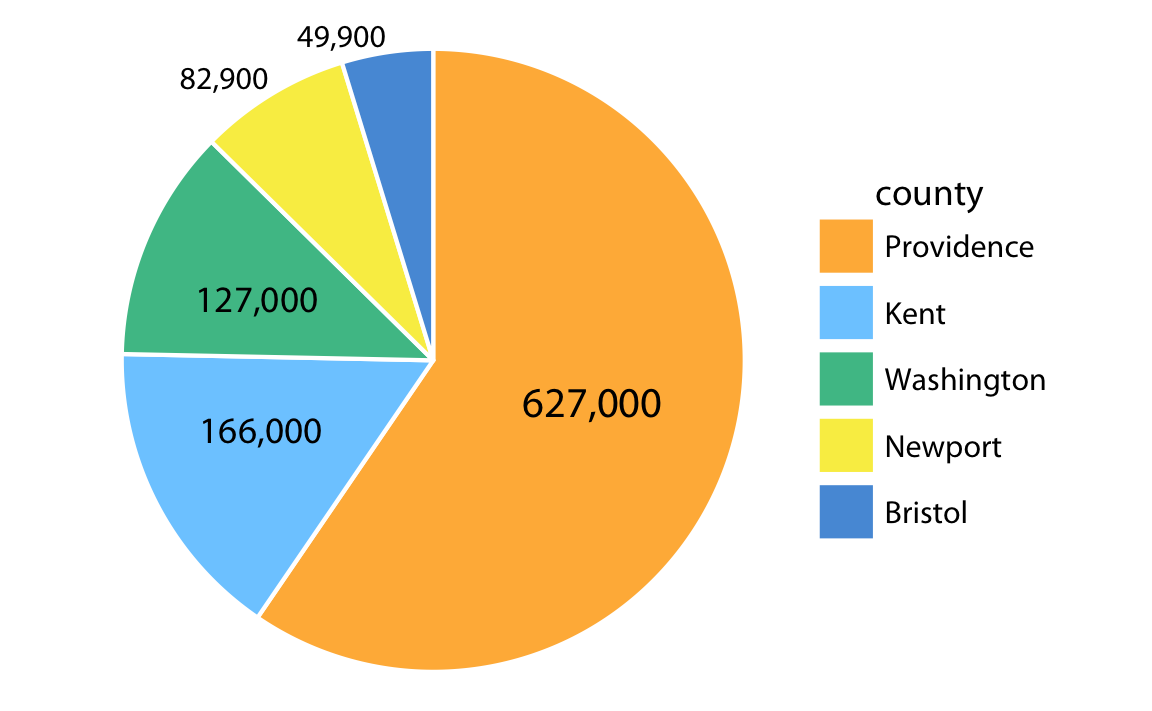
Pie chart
Bar graph
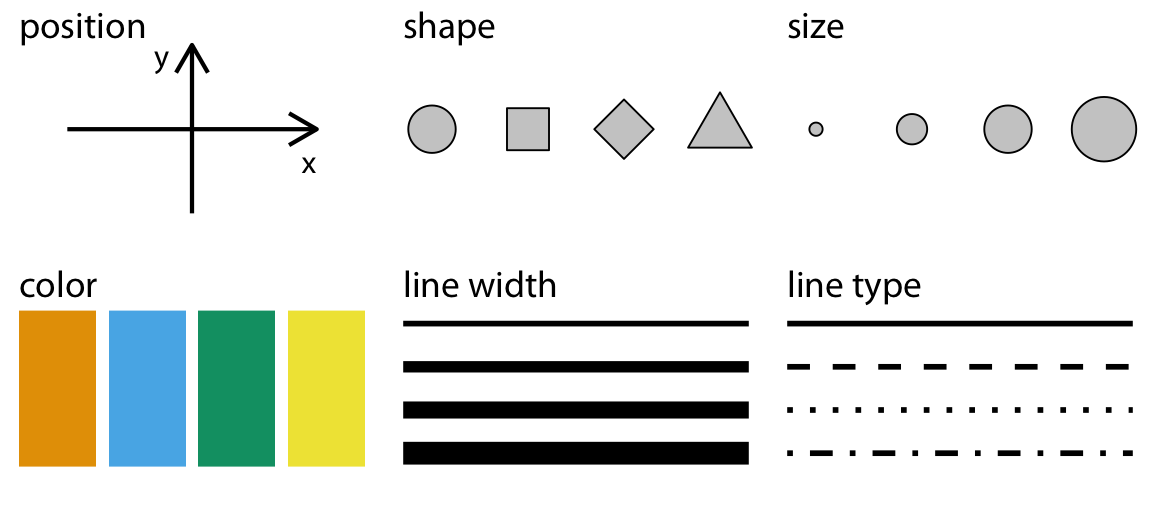
Aesthetics

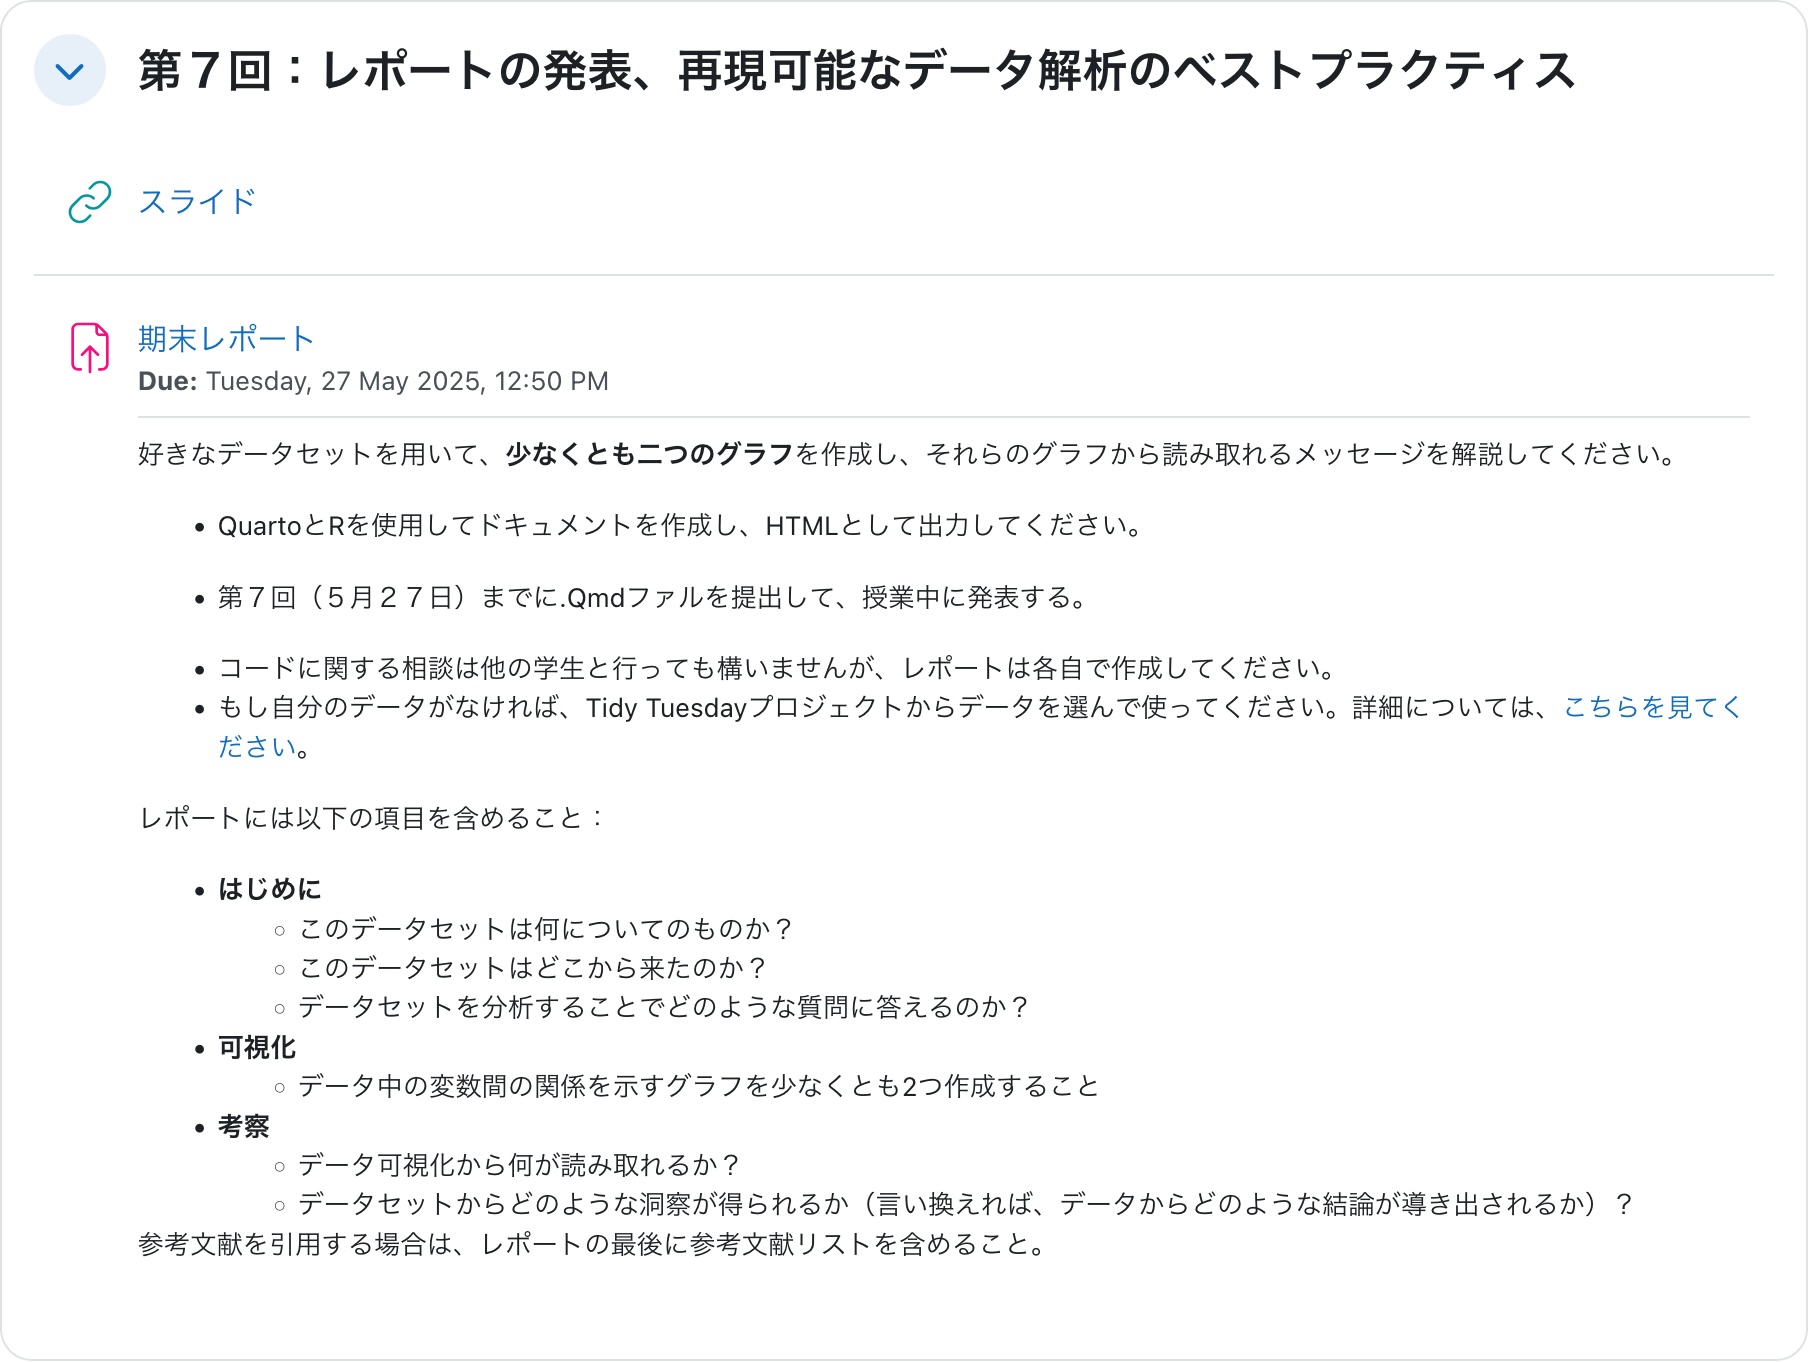
palmerpenguinsについて

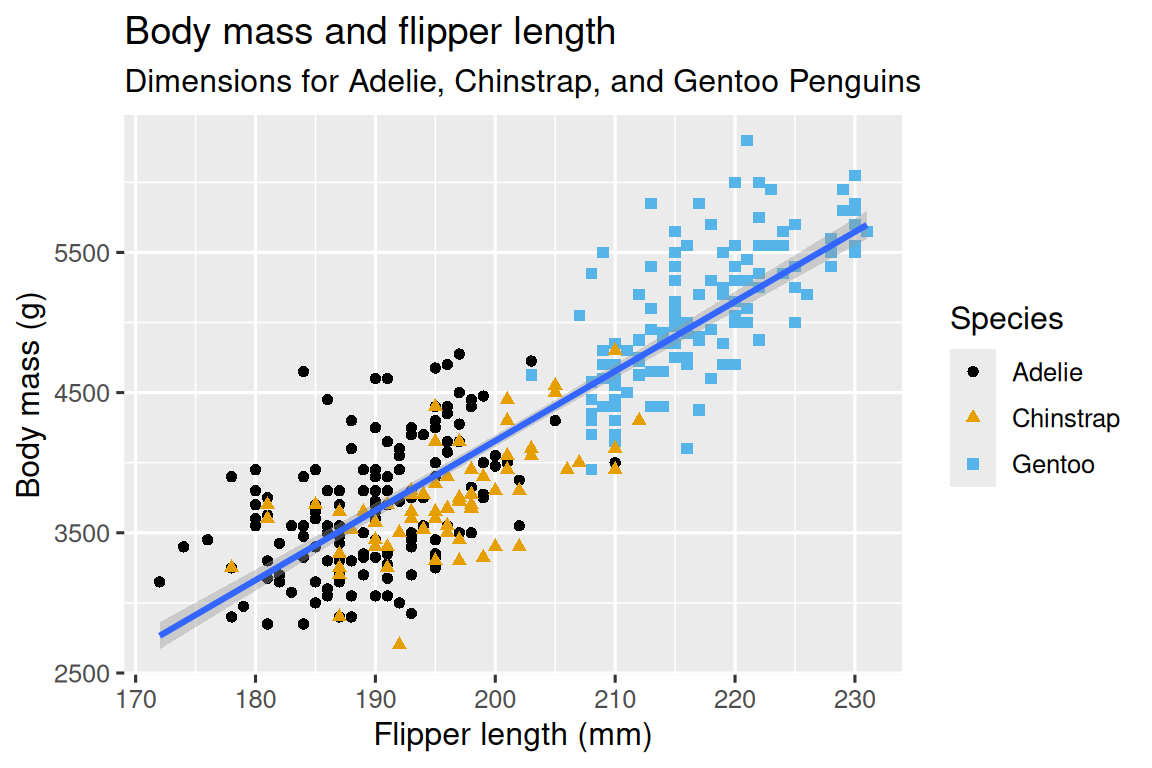
目的:このグラフを作る
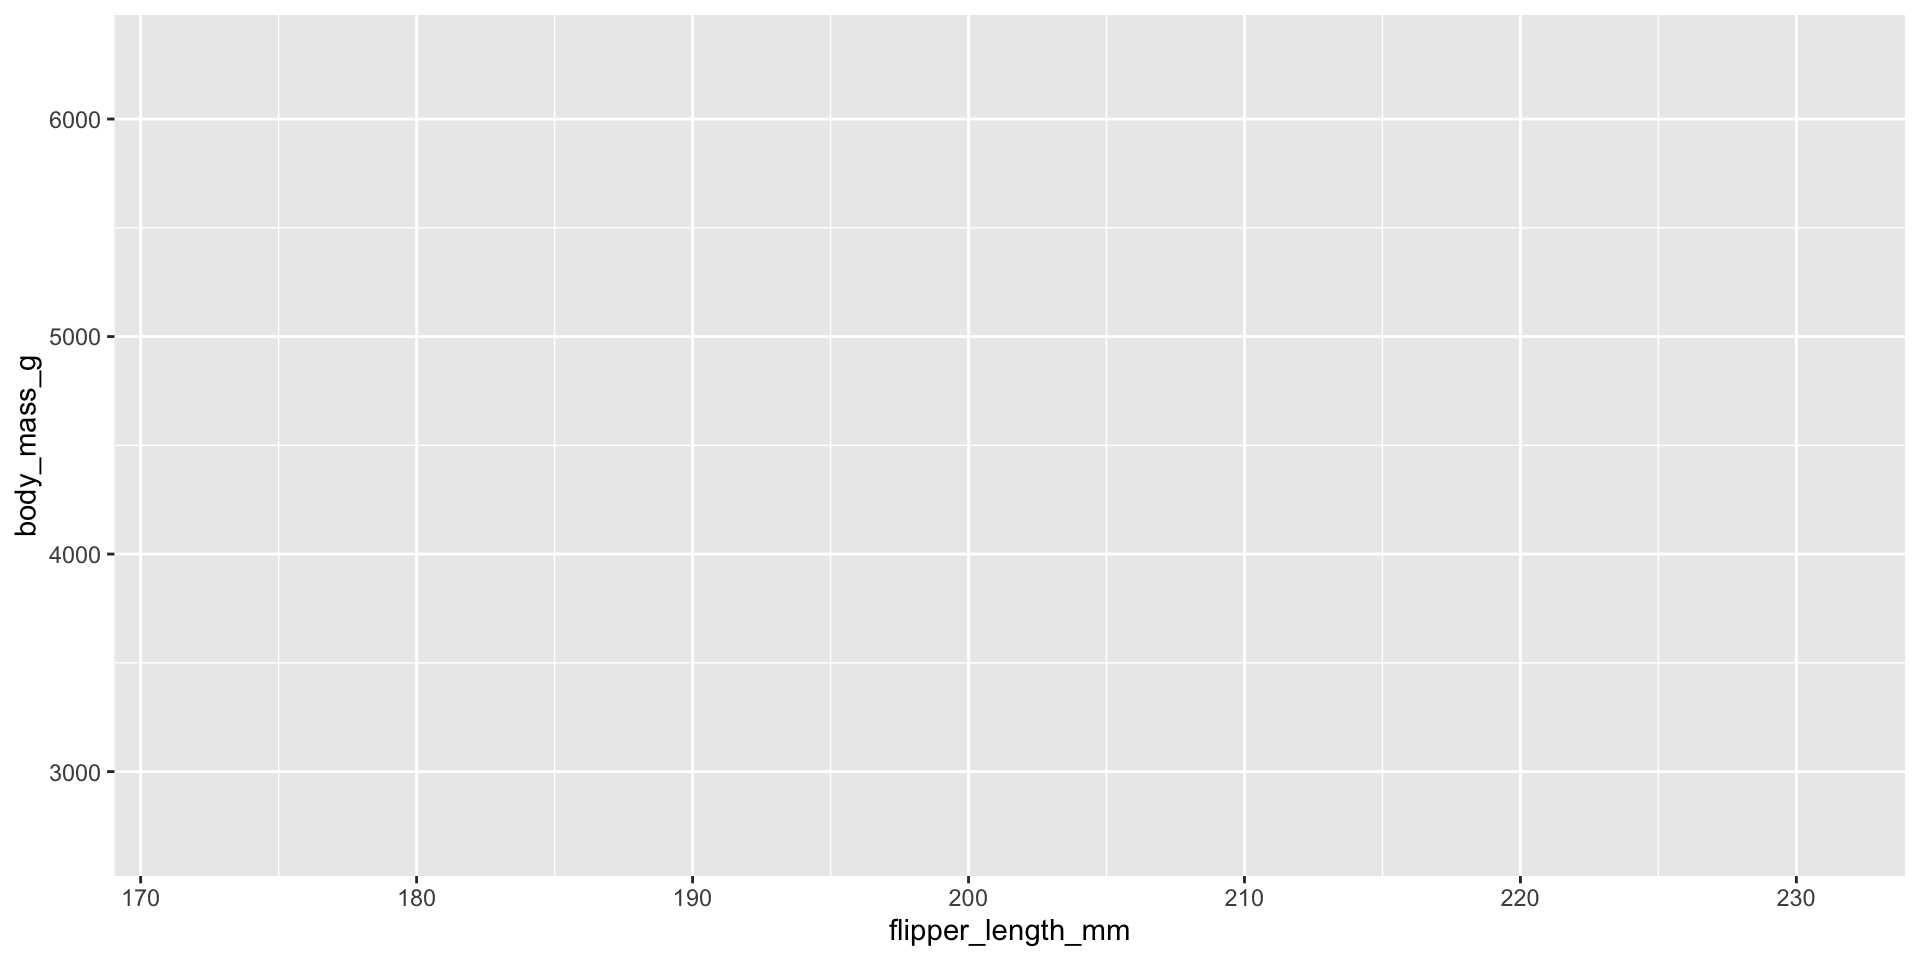
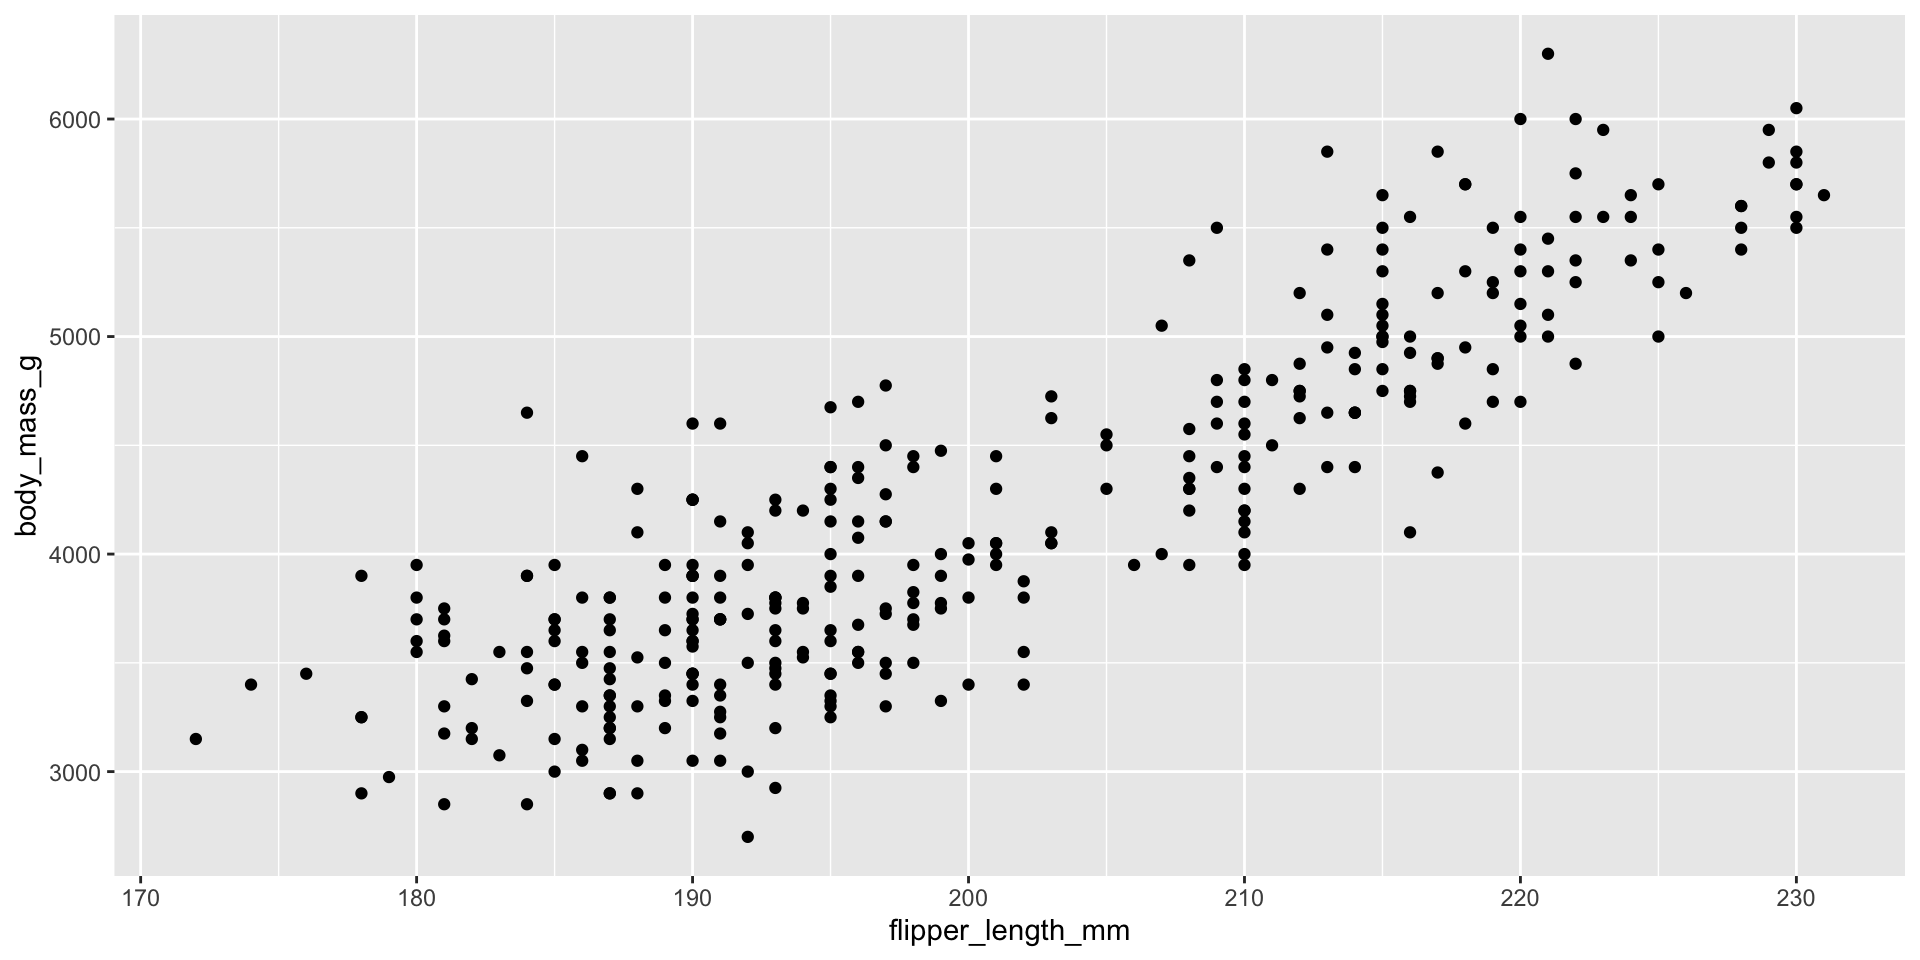
ggplot()でグラフの基盤を作る

mapping()で座標を指定する

mapping()で座標を指定する
geom_()でデータの形を指定する

geom_()でデータの形を指定する
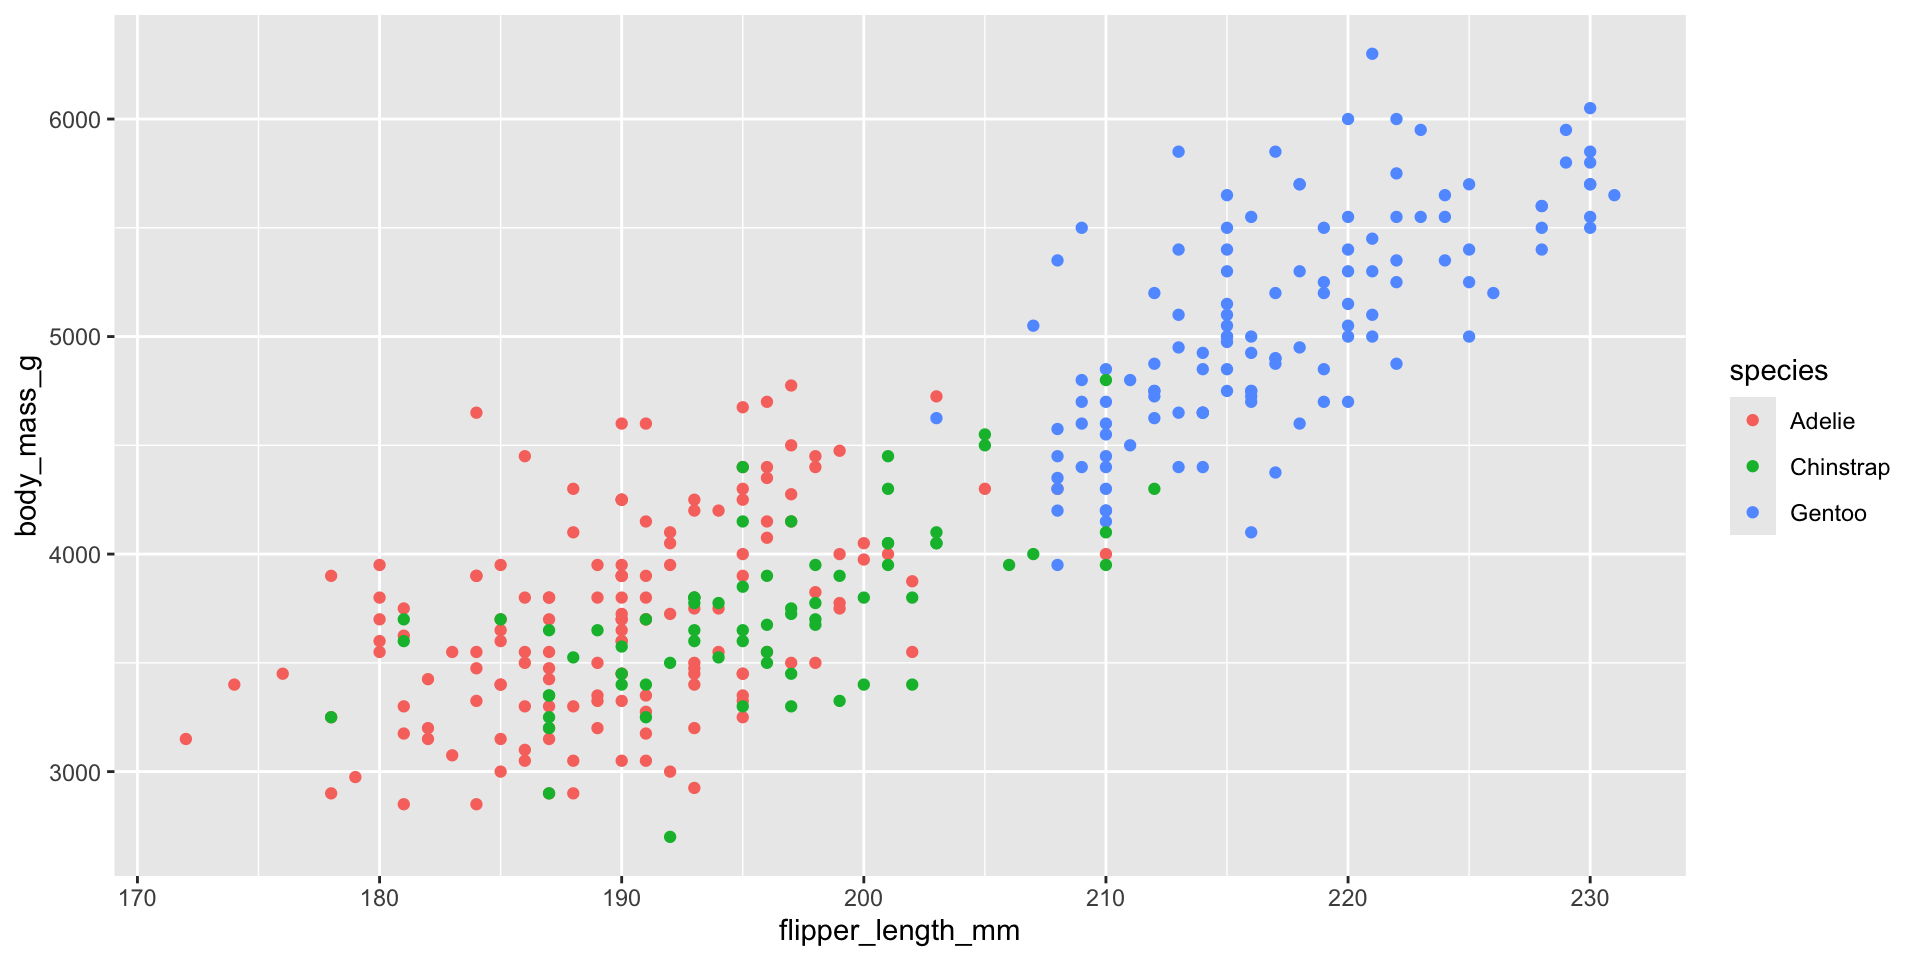
colorで色を潰す

colorで色を潰す
geom_smooth()回帰直線を付け加える

geom_smooth()回帰直線を付け加える
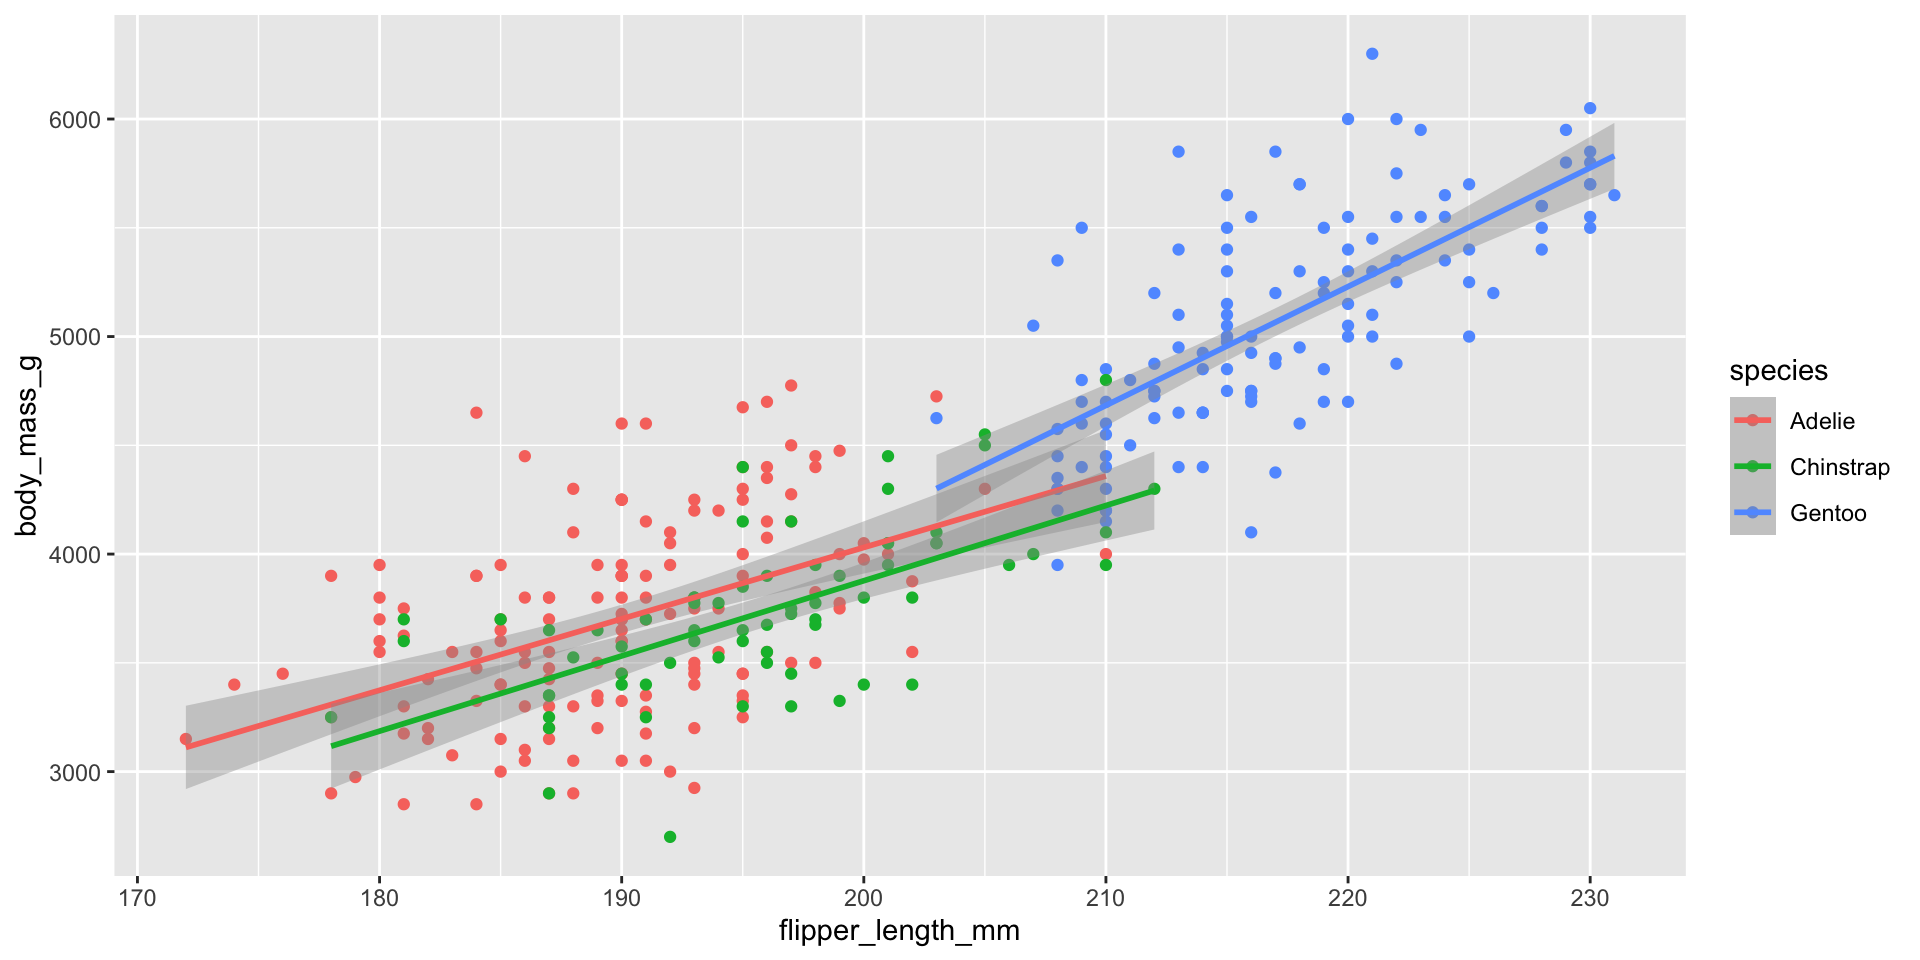
目的の図と何か違う・・


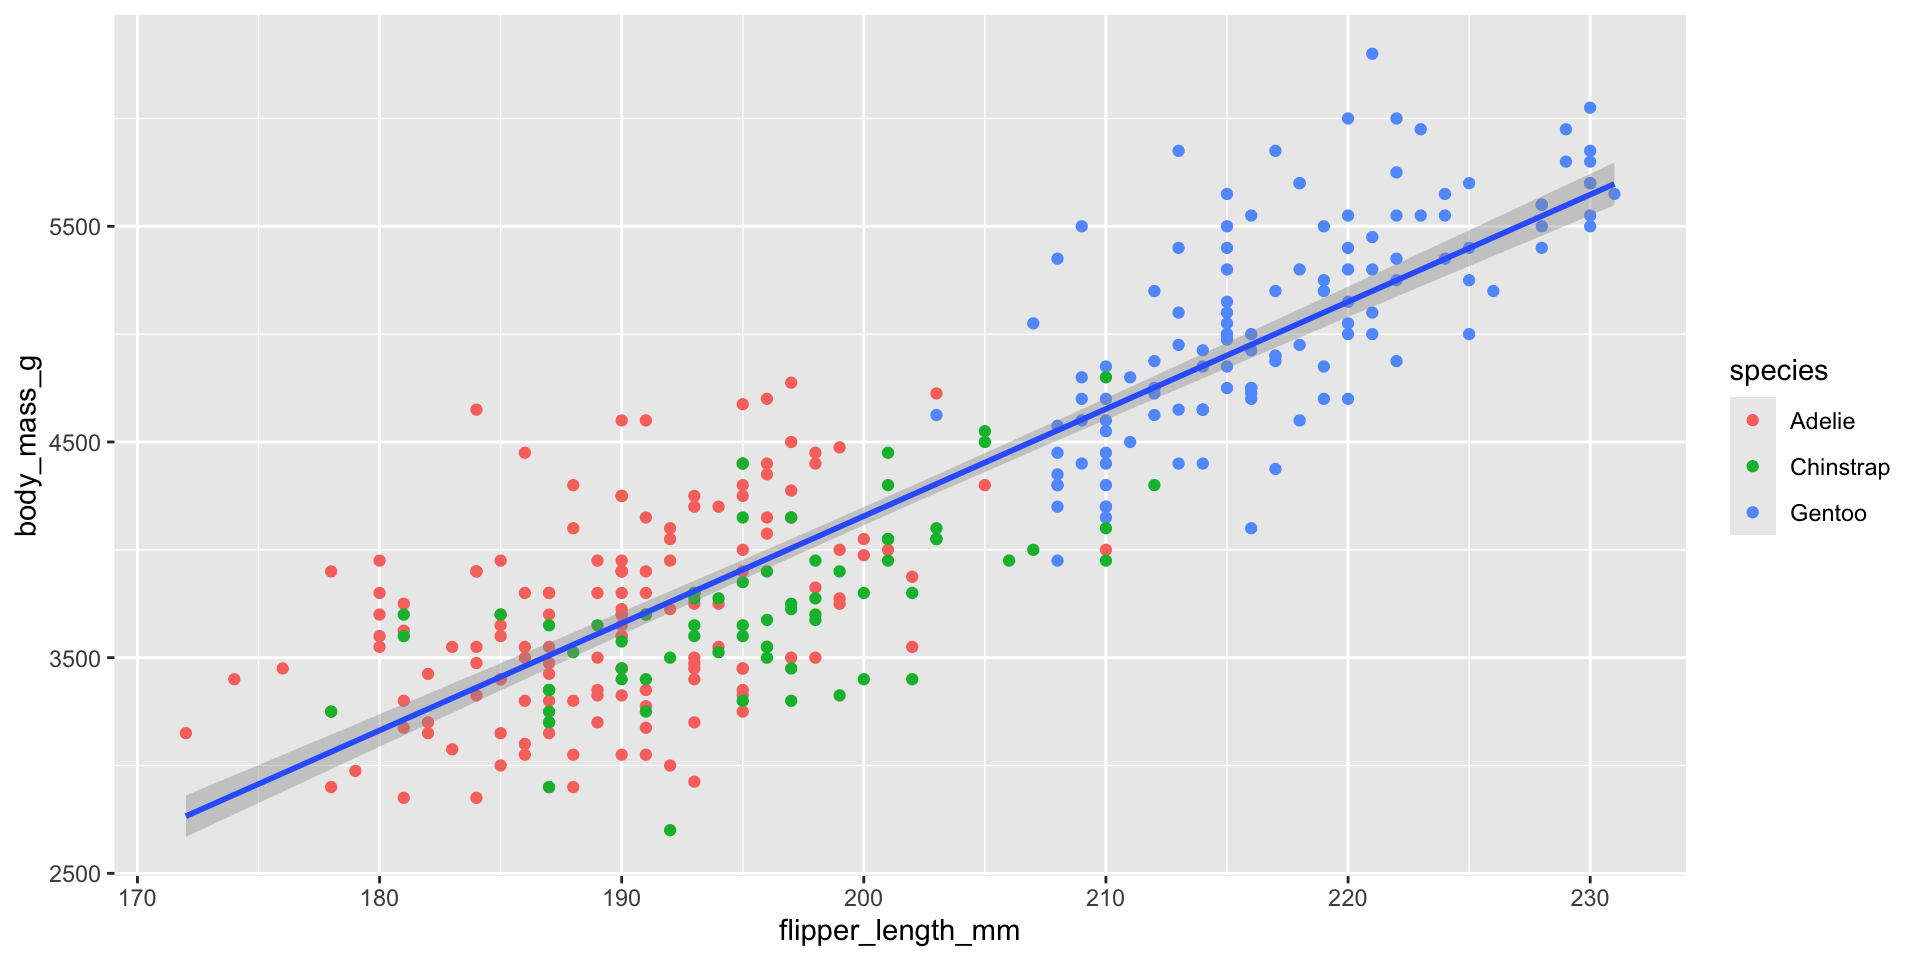
geom_smooth()とgeom_point()で指定したい要素を考えよう


colorをgeom_point()だけ指定しよう

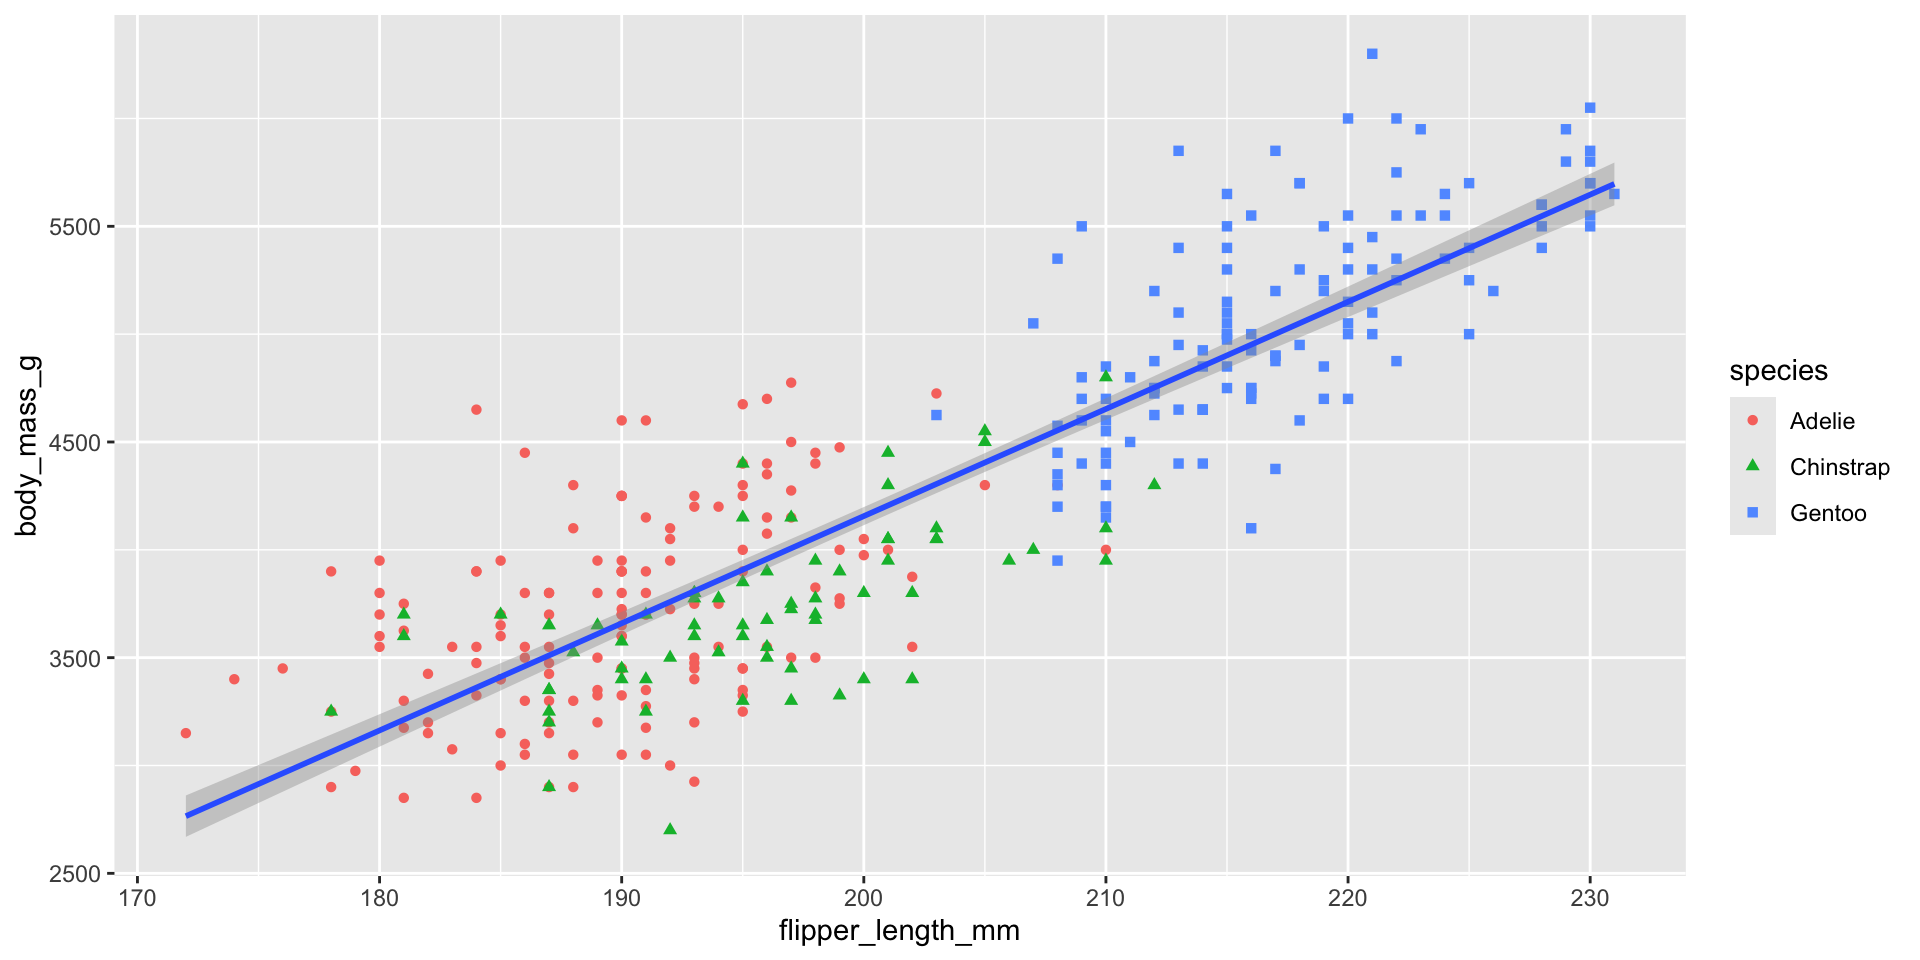
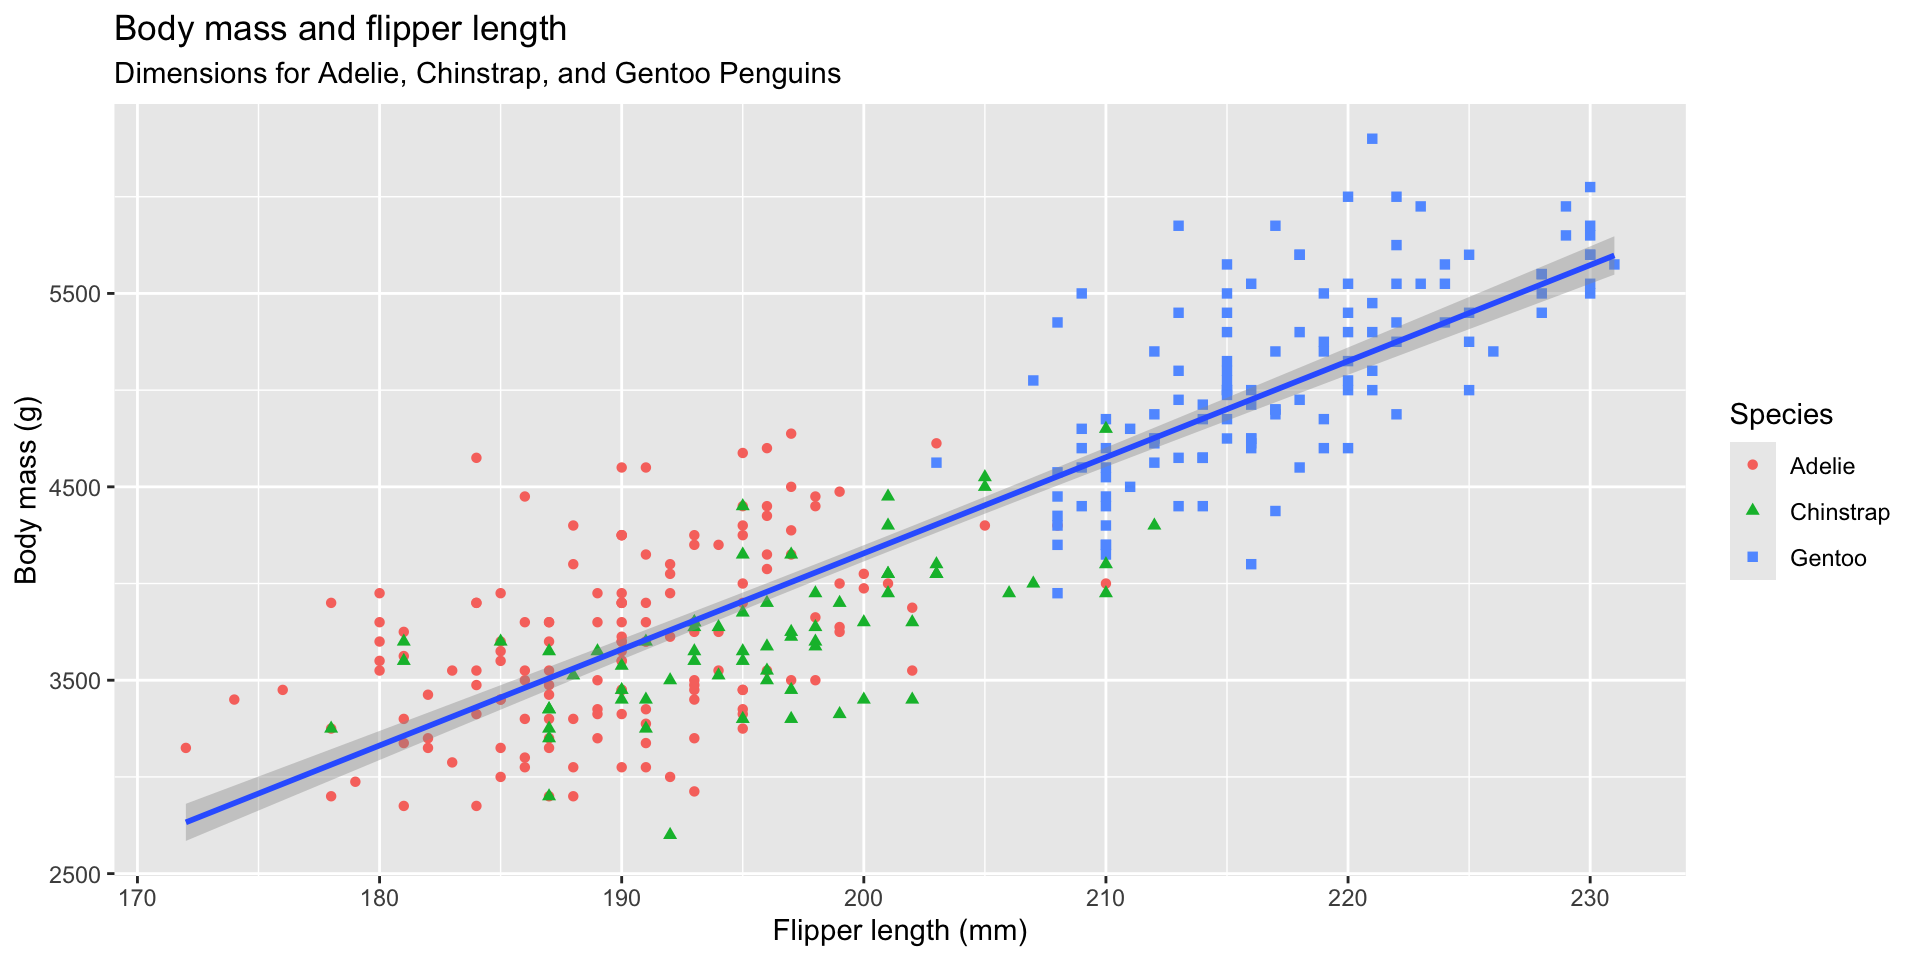
labs()でラベルをきれいにする
ggplot(
  data = penguins,
  mapping = aes(x = flipper_length_mm, y = body_mass_g)
) +
  geom_point(mapping = aes(color = species, shape = species)) +
  geom_smooth(method = "lm") +
  labs(
    title = "Body mass and flipper length",
    subtitle = "Dimensions for Adelie, Chinstrap, and Gentoo Penguins",
    x = "Flipper length (mm)", y = "Body mass (g)",
    color = "Species", shape = "Species"
  )
labs()でラベルを整える
ggplot(
  data = penguins,
  mapping = aes(x = flipper_length_mm, y = body_mass_g)
) +
  geom_point(mapping = aes(color = species, shape = species)) +
  geom_smooth(method = "lm") +
  labs(
    title = "Body mass and flipper length",
    subtitle = "Dimensions for Adelie, Chinstrap, and Gentoo Penguins",
    x = "Flipper length (mm)", y = "Body mass (g)",
    color = "Species", shape = "Species"
  )
scale_colorで色を変える
ggplot(
  data = penguins,
  mapping = aes(x = flipper_length_mm, y = body_mass_g)
) +
  geom_point(mapping = aes(color = species, shape = species)) +
  geom_smooth(method = "lm") +
  labs(
    title = "Body mass and flipper length",
    subtitle = "Dimensions for Adelie, Chinstrap, and Gentoo Penguins",
    x = "Flipper length (mm)", y = "Body mass (g)",
    color = "Species", shape = "Species"
  ) +
  scale_color_colorblind()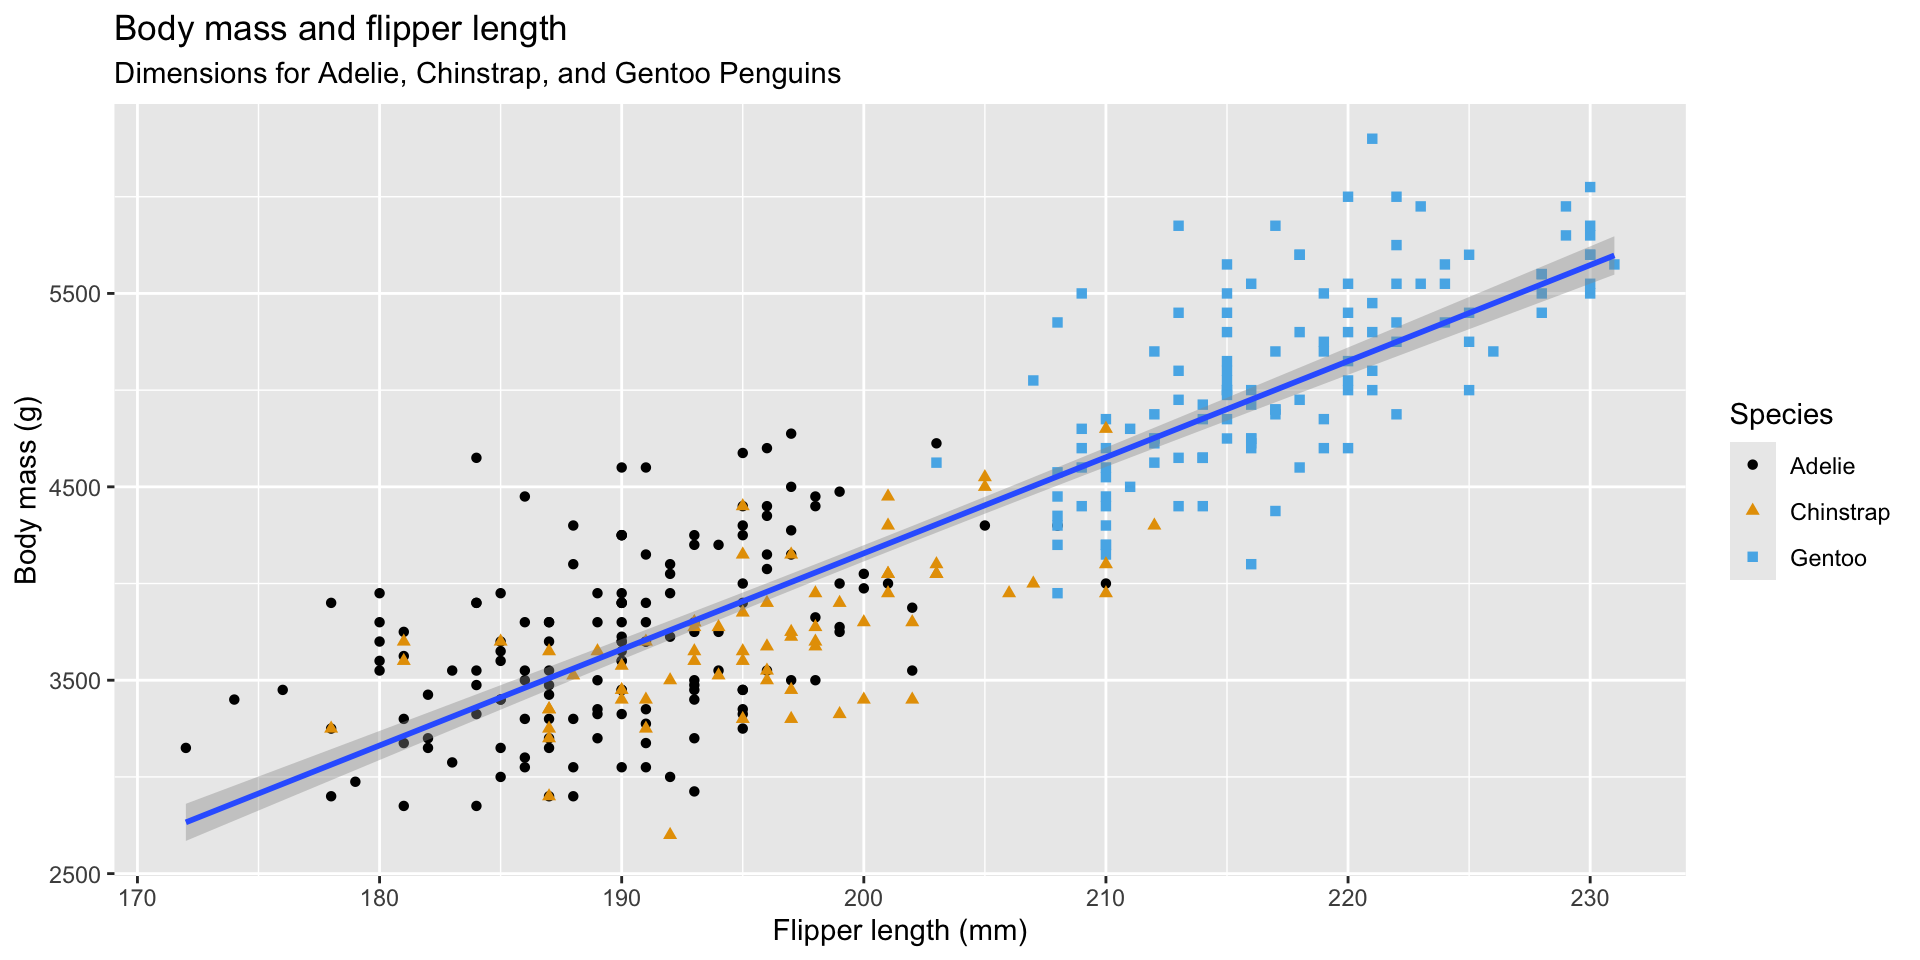
よりもコンパクトな書き方
data =とmapping =を書かなくて良い
ggplot(penguins, aes(x = flipper_length_mm, y = body_mass_g)) +
  geom_point(aes(color = species, shape = species)) +
  geom_smooth(method = "lm") +
  labs(
    title = "Body mass and flipper length",
    subtitle = "Dimensions for Adelie, Chinstrap, and Gentoo Penguins",
    x = "Flipper length (mm)", y = "Body mass (g)",
    color = "Species", shape = "Species"
  ) +
  scale_color_colorblind()
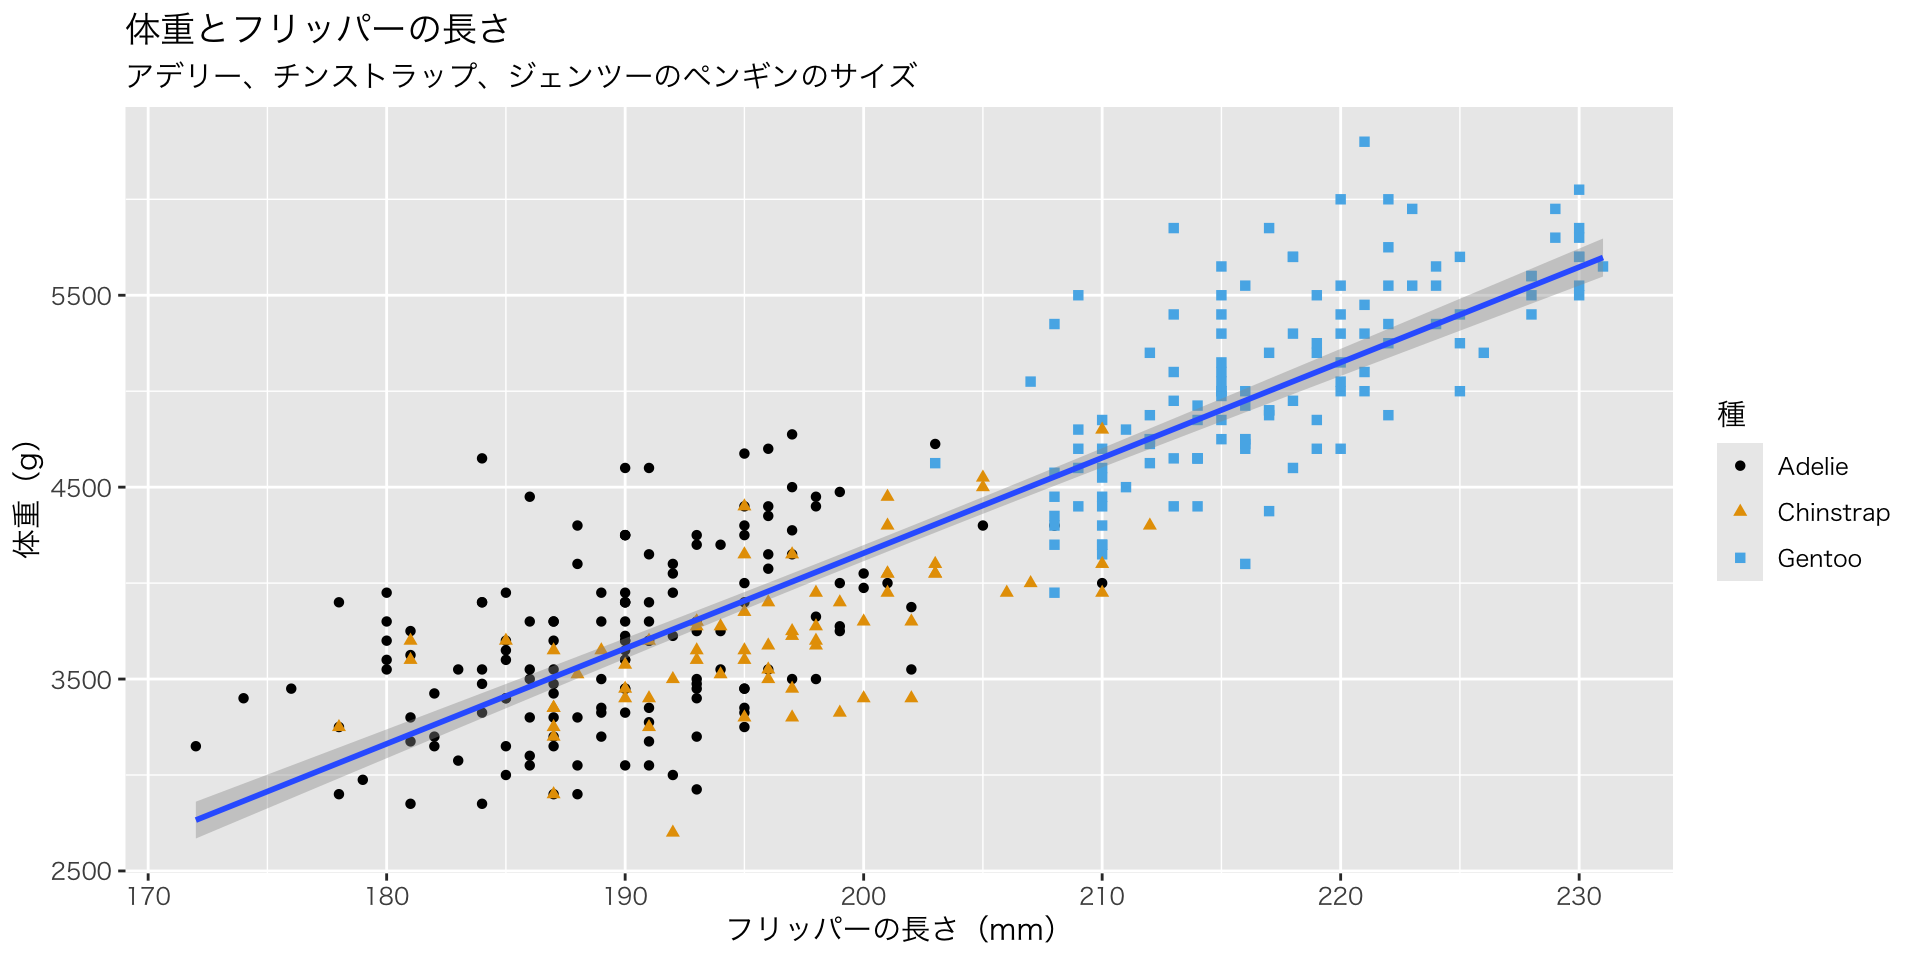
base_familyで文字化けを防ぐ
ggplot(penguins, aes(x = flipper_length_mm, y = body_mass_g)) +
  geom_point(aes(color = species, shape = species)) +
  geom_smooth(method = "lm") +
  labs(
    title = "体重とフリッパーの長さ",
    subtitle = "アデリー、チンストラップ、ジェンツーのペンギンのサイズ",
    x = "フリッパーの長さ(mm)", y = "体重(g)",
    color = "種", shape = "種"
  ) +
  scale_color_colorblind() +
  theme_gray(base_family = "HiraKakuPro-W3")